
Morgan Stanley Says The Hormuz Disruption Is The Largest Oil Supply Shock In History. Here Is What That Means For Tanker Rates.
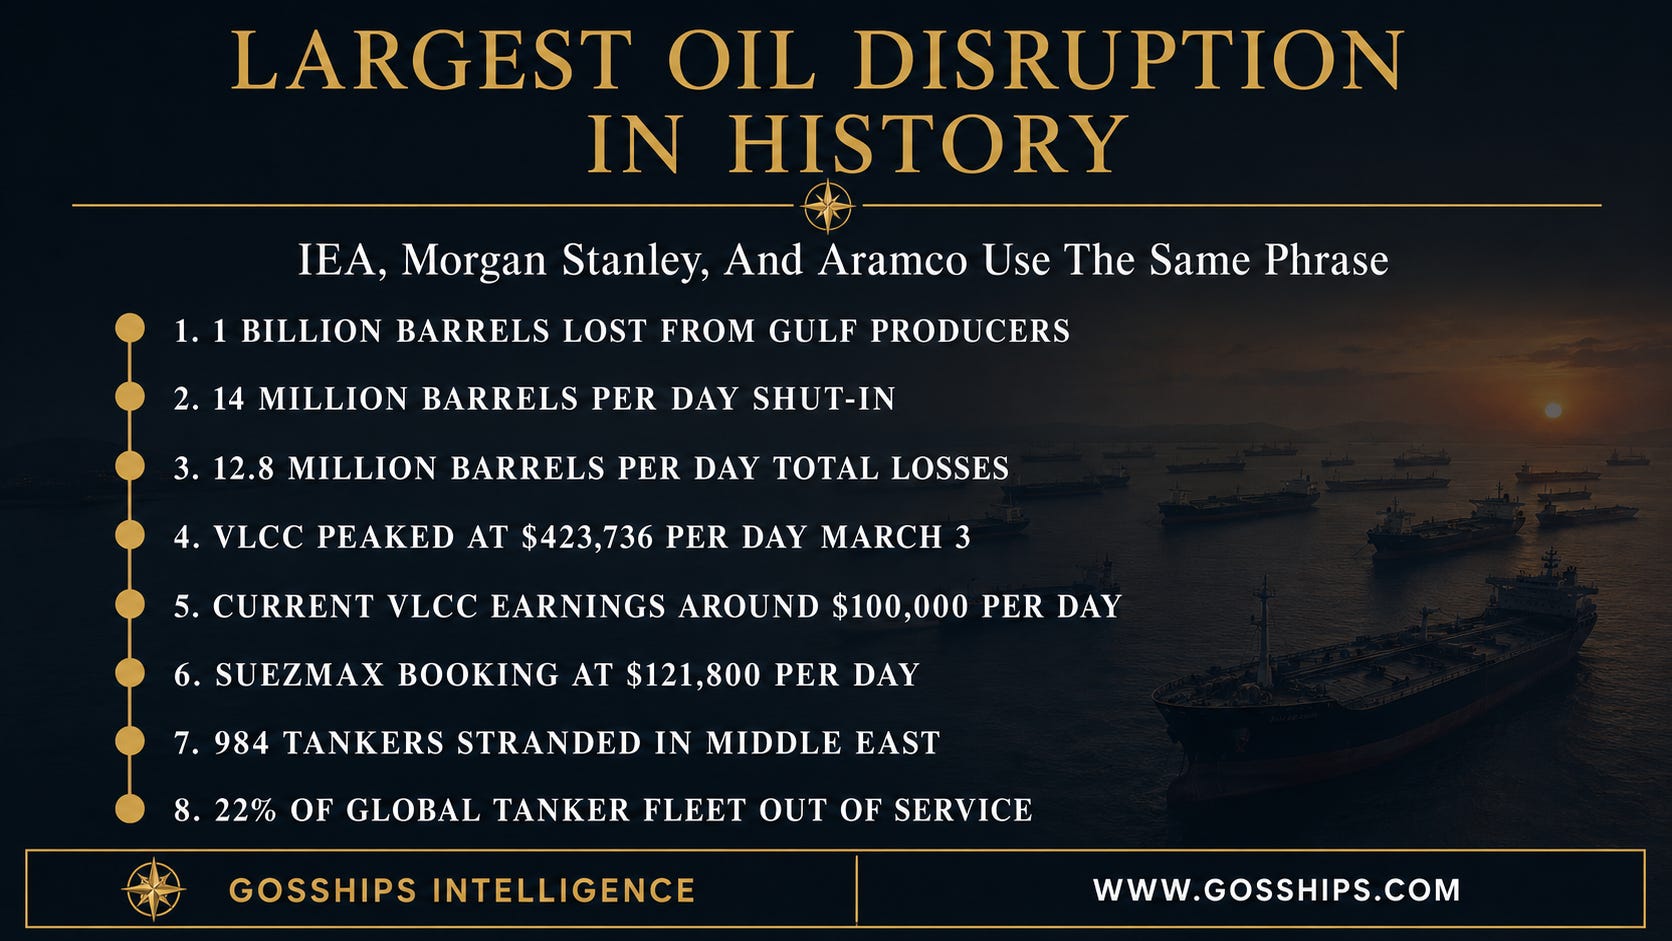
The IEA, Saudi Aramco, And Morgan Stanley Now Use The Same Phrase. Over 1 Billion Barrels Lost. VLCC Rates Peaked At $423,736 Per Day In March.


Three of the most influential institutions in oil have now said the same thing using the same words. Morgan Stanley commodities strategist Martijn Rats told clients in a May note: “That this is the largest oil supply disruption in the history of the oil market is neither an exaggeration nor controversial," per CNBC. International Energy Agency Executive Director Fatih Birol used the same framing in the IEA’s May Oil Market Report. Saudi Aramco CEO Amin Nasser used the same framing in his most recent investor communication. Three independent top-tier authorities. One conclusion. The disruption to oil flows through the Strait of Hormuz is now the largest in the history of the oil market.
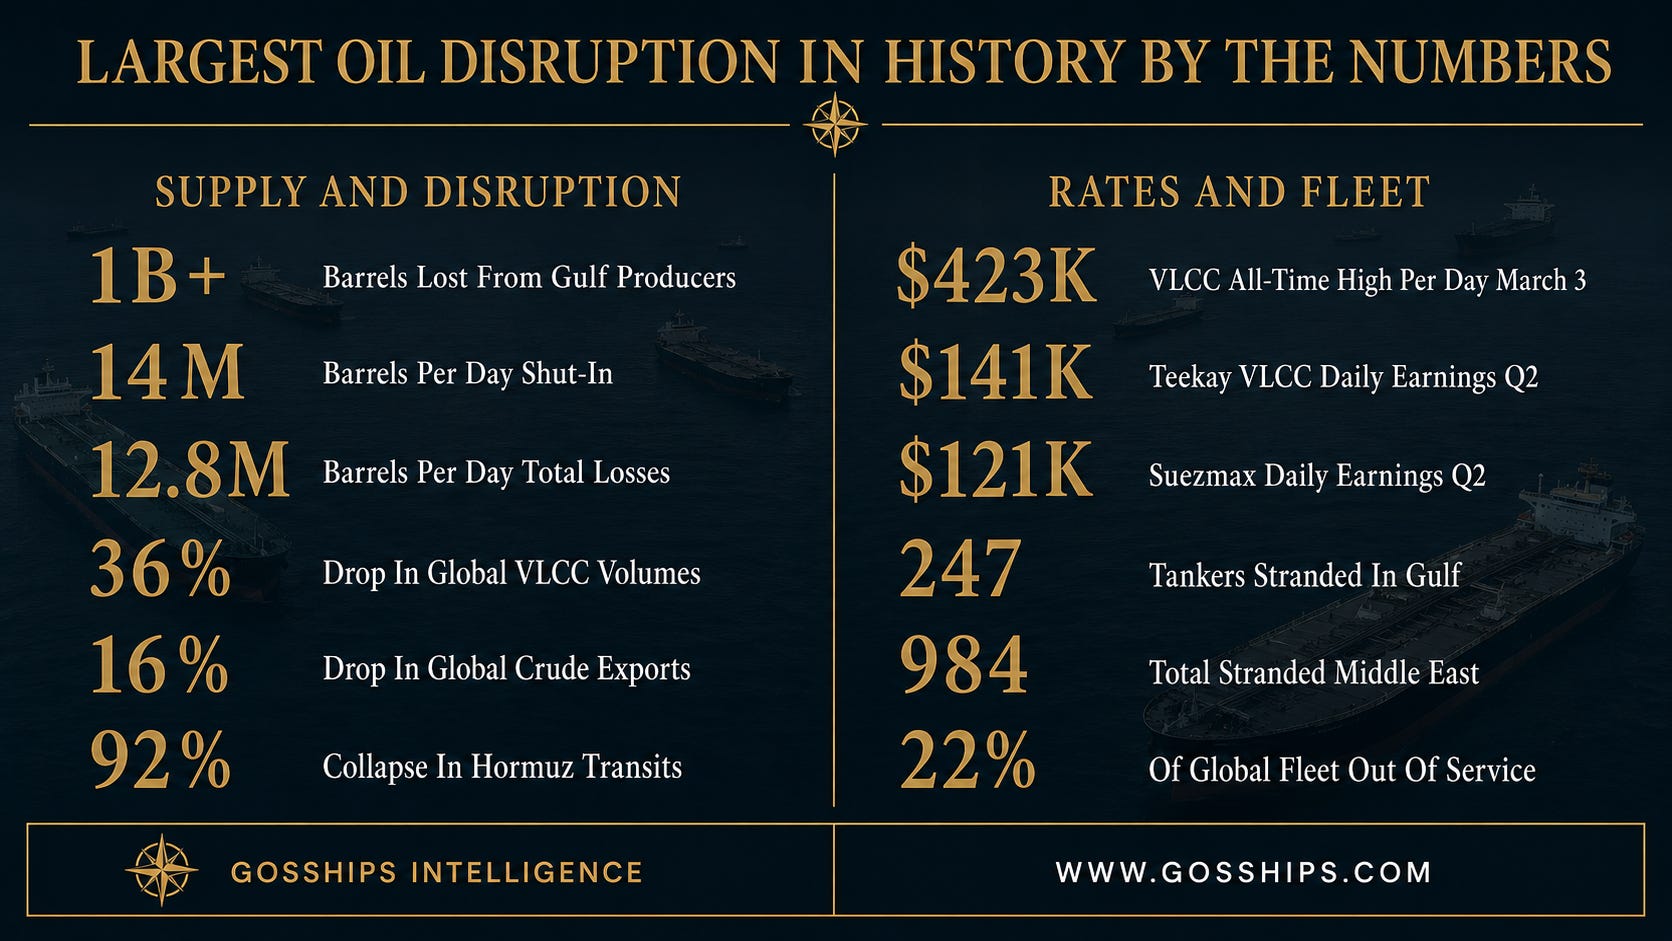
The numbers behind that conclusion are equally consequential. Cumulative supply losses from Gulf producers have already exceeded 1 billion barrels, with more than 14 million barrels per day of oil now shut in per the IEA May report. That is equivalent to roughly 10% of total global oil consumption, per CNBC analysis citing the IEA. Total losses since the war began on February 28 stand at 12.8 million barrels per day. VLCC freight rates spiked to an all-time high of $423,736 per day on March 3 per LSEG data, and have since stabilized at around $100,000 per day per Fearnleys. Suezmax tankers are now earning $121,800 per day on 60% of available days per Teekay Tankers Q2 disclosure. The structural shock to the tanker market is unfolding in real time, and by Gosships analysis, the rate normalization most operators expected through summer is not arriving.
📋 In this issue:
🛢️ The Story
📊 By The Numbers
🔍 Why It Matters
👀 What to Watch
🚨 Gosships Signal
📊 Get The Deep Water Report
→ Global Tanker Market Outlook Q2 2026
📋 Competency-Based Maritime Training
→ SwiftAction
📌 Gosships Data Card
→ Cumulative Gulf Supply Losses: Over 1 Billion Barrels Per IEA May Report
→ Daily Oil Shut-In: 14 Million Barrels Per Day Per IEA
→ Total Losses Since February 28: 12.8 Million Barrels Per Day Per IEA
→ VLCC All-Time High Rate: $423,736 Per Day On March 3 Per LSEG
→ Current VLCC Daily Earnings: Around $100,000 Per Day Per Fearnleys
→ Teekay Q2 Suezmax: $121,800 Per Day On 60% Of Days
→ Teekay Q2 Aframax/LR2: $98,000 Per Day On 53% Of Days
→ Teekay Q2 Single VLCC: $141,800 Per Day On 71% Of Days
→ Tankers Stranded In Middle East Gulf: 247 Per Kpler
→ Tankers Stranded Broader Middle East: 984 Per Kpler (22% Of Global Fleet)
→ VLCC Volume Drop: 36% Versus Prewar Per Vortexa
→ Global Crude Export Drop: 16% Versus Prewar Per Vortexa
→ Atlantic-Pacific VLCC Voyage Share: 35% Now Versus 22% Prewar Per Vortexa
→ Cape Of Good Hope Route: 2.6 Times Longer Than Hormuz Route
→ Brent Crude Range April: $144 High To $100 Low Per IEA
🛢️ The Story
The phrase “largest oil supply disruption in the history of the oil market” has now been deployed independently by three of the most authoritative voices in oil. Morgan Stanley’s Martijn Rats wrote in a May note to clients per CNBC: “That this is the largest oil supply disruption in the history of the oil market is neither an exaggeration nor controversial. Saudi Aramco CEO Amin Nasser and International Energy Agency chief Fatih Birol have described the disruption in the same terms.”
The data backs the framing. Per the IEA’s May Oil Market Report, cumulative supply losses from Gulf producers have already exceeded 1 billion barrels, with more than 14 million barrels per day of oil now shut in. Total global oil supply declined by a further 1.8 million barrels per day in April to 95.1 million barrels per day, taking total losses since February 28 to 12.8 million barrels per day. Output from Gulf countries affected by the closure of the Strait of Hormuz was 14.4 million barrels per day below pre-war levels per IEA.
The IEA report concludes that more than ten weeks after the war in the Middle East began, mounting supply losses from the Strait of Hormuz are depleting global oil inventories at a record pace. Refinery crude throughputs are forecast to plunge by 4.5 million barrels per day in Q2 2026 to 78.7 million barrels per day per IEA, and by 1.6 million barrels per day to 82.3 million barrels per day for 2026 as a whole. Global observed oil inventories drew by 129 million barrels in March and by a further 117 million barrels in April per IEA preliminary data. On-land stocks dropped by 170 million barrels (-5.7 million barrels per day) in April, while oil on water rebounded by 53 million barrels. OECD countries’ on-land stocks plummeted by 146 million barrels (-4.9 million barrels per day) per IEA.
For tanker operators, the question is what 14 million barrels per day of shut-in oil means for charter rates, vessel positioning, and the broader supply-demand framework for tanker capacity. VLCC daily earnings hit an all-time high of $423,736 per day on March 3 per LSEG, marking an increase of more than 94% from the prior Friday’s close. Per Fearnleys via Lloyd’s List, VLCC daily earnings have since stabilized around $100,000 per day, with the firm noting “lack of volume is now starting to bite in earnest, and with that, rates continue to be under pressure.”
The “tonnes” carried aboard VLCCs are down sharply since the effective closure of the Strait of Hormuz. But the “miles” are higher, as more Atlantic basin crude is loading for delivery to Asia. Per Vortexa data via Lloyd’s List, global seaborne crude and condensate exports averaged 36.3 million barrels per day in the eight weeks ending May 3. That is down 6.8 million barrels per day or 16% versus the pre-war average from January 2025 to February 2026. VLCCs, due to their high exposure to the Middle East Gulf, are down more than other crude tanker segments. Global crude exports on VLCCs averaged 14.4 million barrels per day over the past eight weeks, down 8.1 million barrels per day or 36% versus prewar levels.
The Atlantic-to-Pacific voyage trade around the Cape of Good Hope is the structural tonne-mile driver replacing Hormuz volume per Lloyd’s List. The distance between Galveston, Texas and Ningbo, China is 2.6 times longer than the distance between Ras Tanura, Saudi Arabia and Ningbo. Atlantic-to-Pacific voyages accounted for 35% of crude export volumes on VLCCs in the past eight weeks, versus just 22% in January 2025 to February 2026 per Vortexa. In the week ending April 26, Atlantic exports on VLCCs averaged 8.1 million barrels per day, courtesy of the release of US strategic petroleum reserves.
Mid-size tanker rates tell the structural story even more clearly. Teekay Tankers told investors on May 14 per IndexBox that Suezmax and Aframax/LR2 spot rates averaged $61,000 per day in Q1 2026.
In Q2 through mid-May, rates have escalated further. Suezmaxes are booked at $121,800 per day on 60% of available days. Aframax/LR2 vessels are booked at $98,000 per day on 53% of available days. Teekay’s single VLCC is booked at $141,800 per day on 71% of available days. Teekay CEO Kenneth Hvid told investors that around 100 Aframax-sized or larger tankers are stuck west of Hormuz, including 59 VLCCs, equivalent to about 8% of the non-sanctioned VLCC fleet, with another 86 vessels idling outside the strait or off India’s west coast.
The fleet stranding numbers are the structural mechanism behind the rate compression. Per Kpler vessel tracking data, 247 vessels of MR size or larger remain stranded in the Middle East Gulf, representing roughly 6% of global tanker DWT capacity. Expanding to the broader Middle East region lifts the figure to 984 tankers, or approximately 22% of the global fleet. Tanker transits through the Strait of Hormuz have collapsed by approximately 92% compared to the week prior to the conflict per Kpler.
The geopolitical setup is not resolving on schedule. Per Trump’s Hannity interview reported by CBS News in late April, the president said he was running out of patience on an Iran deal: “I’m not going to be much more patient. They should make a deal.” The Trump-Xi summit in Beijing on May 14 produced a joint commitment per the White House readout via CBS News, TIME, and CNBC that the Strait of Hormuz “must remain open.” The same day, the Honduras-flagged Hui Chuan was seized 38 nautical miles off Fujairah by “unauthorised personnel” per UKMTO Warning 057/26 and redirected to Iranian waters. Iran’s behavior did not change.
The Yuan Hua Hu transit on Wednesday May 13 confirmed the structural setup. A China COSCO Shipping official told the Wall Street Journal that Iran waived its standard $2 million transit toll on the 2 million barrel Iraqi crude shipment, viewing the waiver as a gesture from Tehran timed to the Trump-Xi summit. By Gosships analysis, the strait is no longer closed. It is also not open. It is a permit-based corridor with two-tier access. Chinese state-owned vessels with IRGC approval pass without tolls. Everyone else faces the blockade.
For tanker operators, the rate framework through summer is structurally elevated even if Hormuz reopens partially. The 1 billion barrels of cumulative supply losses do not simply rebuild on a switch flip. Morgan Stanley forecasts the market will lose another billion barrels over the course of 2026 due to the time required to restart oilfields, repair refineries, and reposition the tanker fleet, per Rats via CNBC. The tanker repositioning point is critical. With 247 tankers stranded in the MEG and 984 broader Middle East tankers idled, the unwinding of stranded tonnage is itself a multi-month process. Charter rates cannot revert to prewar levels until the stranded fleet returns to the active trading pool.
The Greek shipowner bet that you read about in our last article is the early positioning trade ahead of this rate framework. Greek principals placed 102 newbuilding orders worth $10.1 billion in Q1 2026 per Xclusiv Shipbrokers, with 63 of those 102 being tankers. The Greeks are buying tankers like they already know how this ends, and the Morgan Stanley + IEA + Aramco synthesis tells the rest of the market what the Greeks already knew. The post-Hormuz tanker market is structurally different from what was priced in before February 28.
📰 Related Coverage:
A 2 Million Barrel COSCO Supertanker Just Cleared Hormuz And The Gulf Of Oman
The Greeks Are Cornering The Tanker Market Before Posidonia Even Opens
📊 By The Numbers
→ 1 Billion Plus Cumulative Gulf Supply Losses Per IEA
→ 14 Million Barrels Per Day Shut-In Per IEA
→ 12.8 Million Barrels Per Day Total Losses Since February 28 Per IEA
→ $423,736 VLCC All-Time High Rate March 3 Per LSEG
→ $100,000 Current VLCC Daily Earnings Per Fearnleys
→ $121,800 Suezmax Per Day On 60% Of Days Per Teekay Q2
→ $141,800 Teekay VLCC Per Day On 71% Of Days
→ 247 Tankers Stranded In Middle East Gulf Per Kpler
→ 984 Tankers Stranded Broader Middle East Per Kpler
→ 22% Of Global Fleet Stranded Per Kpler
→ 92% Collapse In Hormuz Tanker Transits Per Kpler
→ 36% Drop In Global VLCC Volumes Per Vortexa
→ 35% Atlantic-Pacific VLCC Share Now Versus 22% Prewar
→ 2.6 Times Longer Cape Of Good Hope Versus Hormuz Route
→ $144 To $100 April Brent Range Per IEA
🔍 Why It Matters
By Gosships analysis, the convergence of the IEA, Morgan Stanley, and Saudi Aramco on the “largest oil supply disruption in history” framing is the most consequential analytical anchor of the war so far. When three independent top-tier institutions reach the same conclusion using identical language, it stops being a debate and becomes the baseline assumption for all forward planning across oil and shipping.
