
Aramco Made $32.5 Billion. The Banks Made $48 Billion. One Tanker Owner Made $559 Million in 90 Days. Who's Paying?
Aramco bypassed the strait, Wall Street traded the chaos, and Frontline cleared $559 million in 90 days. A full, sourced accounting of who got rich off the Hormuz war.

⚓ The Gosships Team
Gosships Intelligence Is Published At Gosships.com
For Sponsorship And Partnership Inquiries Contact intelligence@gosships.com
|⚓ About Us | 🛢️ Exclusive Report | 📋 SwiftAction Training |
🏅Black Gold Membership (*53 Slots Left)
Every crisis creates a ledger, and the 2026 Hormuz war has produced one of the most consequential in modern energy history. On one side of that ledger sits the disruption: roughly 20% of the world’s seaborne oil normally moves through the Strait of Hormuz, and when Iran sealed it, an estimated 7% of the global tanker fleet was removed from effective circulation as detours lengthened voyages, according to Kepler Cheuvreux. Freight rates surged to historic highs. Extreme volatility arrived simultaneously in crude markets, currency markets, fixed-income markets, and insurance markets. On the other side of that ledger sits something that rarely gets named plainly in shipping publications: the beneficiaries. Aramco posted its strongest quarter in years. Wall Street posted one of its best quarters ever. Tanker owners billed rates that would have seemed impossible eighteen months ago. Marine insurers repriced a single Gulf voyage from a rounding error to a seven-figure event. This article names them all, puts a number next to each name, and attributes every figure to a published source. The spine of the story is the tanker market, because that is where the physical disruption traveled first and hit hardest. But the Hormuz war turned out to be a wealth transfer with many recipients, and Gosships readers deserve the full accounting.
📋 In This Issue:
🛢️ The Story
📊 By The Numbers
🔍 Why It Matters
👀 What To Watch
🚨 Gosships Signal
🔔 Not Yet Subscribed? Gosships Intelligence Delivers Oil Shipping Intelligence. Subscribe Here!
📊 Order Our Exclusive Report
→ Global Tanker Market Outlook Q3 2026 Edition
📋 Competency-Based Maritime Training
→ SwiftAction
📌 Gosships Data Card
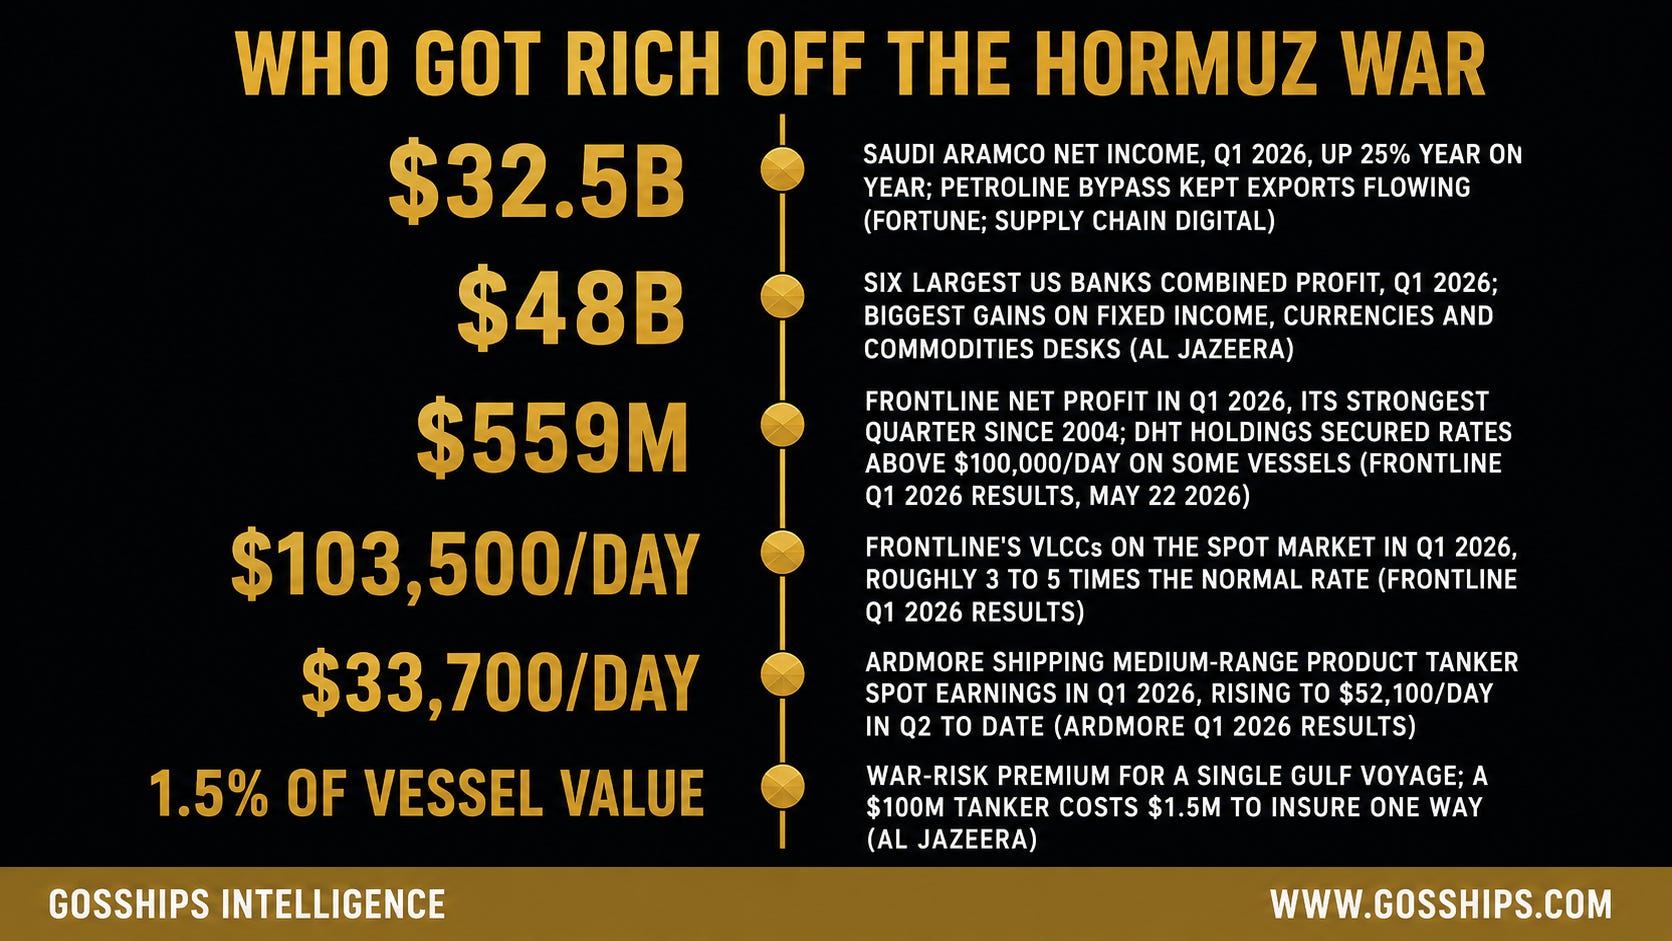
→ $32.5B - Saudi Aramco net income in Q1 2026, up 25% year on year, as the company routed oil through the East-West Petroline to bypass the Strait of Hormuz (Fortune; Supply Chain Digital)
→ $48B - Combined profit of the six largest US investment banks in Q1 2026, with the biggest gains on fixed income, currencies and commodities trading desks (Al Jazeera, June 26, 2026)
→ $559M - Frontline net profit in Q1 2026, its strongest quarter since 2004; DHT Holdings secured charter rates above $100,000/day on some of its vessels (Frontline Q1 2026 results, May 22, 2026)
→ $103,500/day - Frontline's average VLCC spot Time Charter Equivalent in Q1 2026, roughly three to five times the normal rate; International Seaways' VLCCs earned $86,700/day (Frontline; International Seaways Q1 2026 results)
→ $33,700/day - Ardmore Shipping medium-range product tanker spot earnings in Q1 2026, rising to $52,100/day in Q2 to date as product tanker owners also captured the rate surge (Ardmore Q1 2026 results)
→ 1.5% of vessel value - Gulf-transit war-risk premium per single voyage, versus a 0.15-0.25% baseline before the crisis; a $100 million tanker now costs around $1.5 million to insure for one Gulf crossing (Al Jazeera)
Sources: Fortune; Supply Chain Digital, 2026; Al Jazeera, "Who has profited most from the war on Iran?" June 26, 2026; Frontline, International Seaways and Ardmore Q1 2026 results.
🛢️ The Story
Wars are usually described in the language of destruction: ships sunk, ports closed, routes severed, lives lost. The Hormuz crisis of 2026 produced all of that. It also produced something that is rarely described with equal precision in the same breath: a transfer of wealth, running into the hundreds of billions of dollars, from consumers, refiners, and importing economies toward a specific and identifiable set of beneficiaries. This article traces that transfer. It uses only published, attributed figures. It covers the oil producer that turned a chokepoint into a competitive moat, the banks whose trading desks printed money from the volatility, the tanker owners whose daily rates reached levels that would have seemed fictional eighteen months ago, and the insurers who repriced a single Gulf voyage from a negligible premium to a seven-figure event. Because a companion piece covers the oil trading houses in depth, this article gives the traders a brief but attributed mention and devotes its focus to the four categories that have received less attention in mainstream coverage.
The Producer Who Bypassed the Crisis
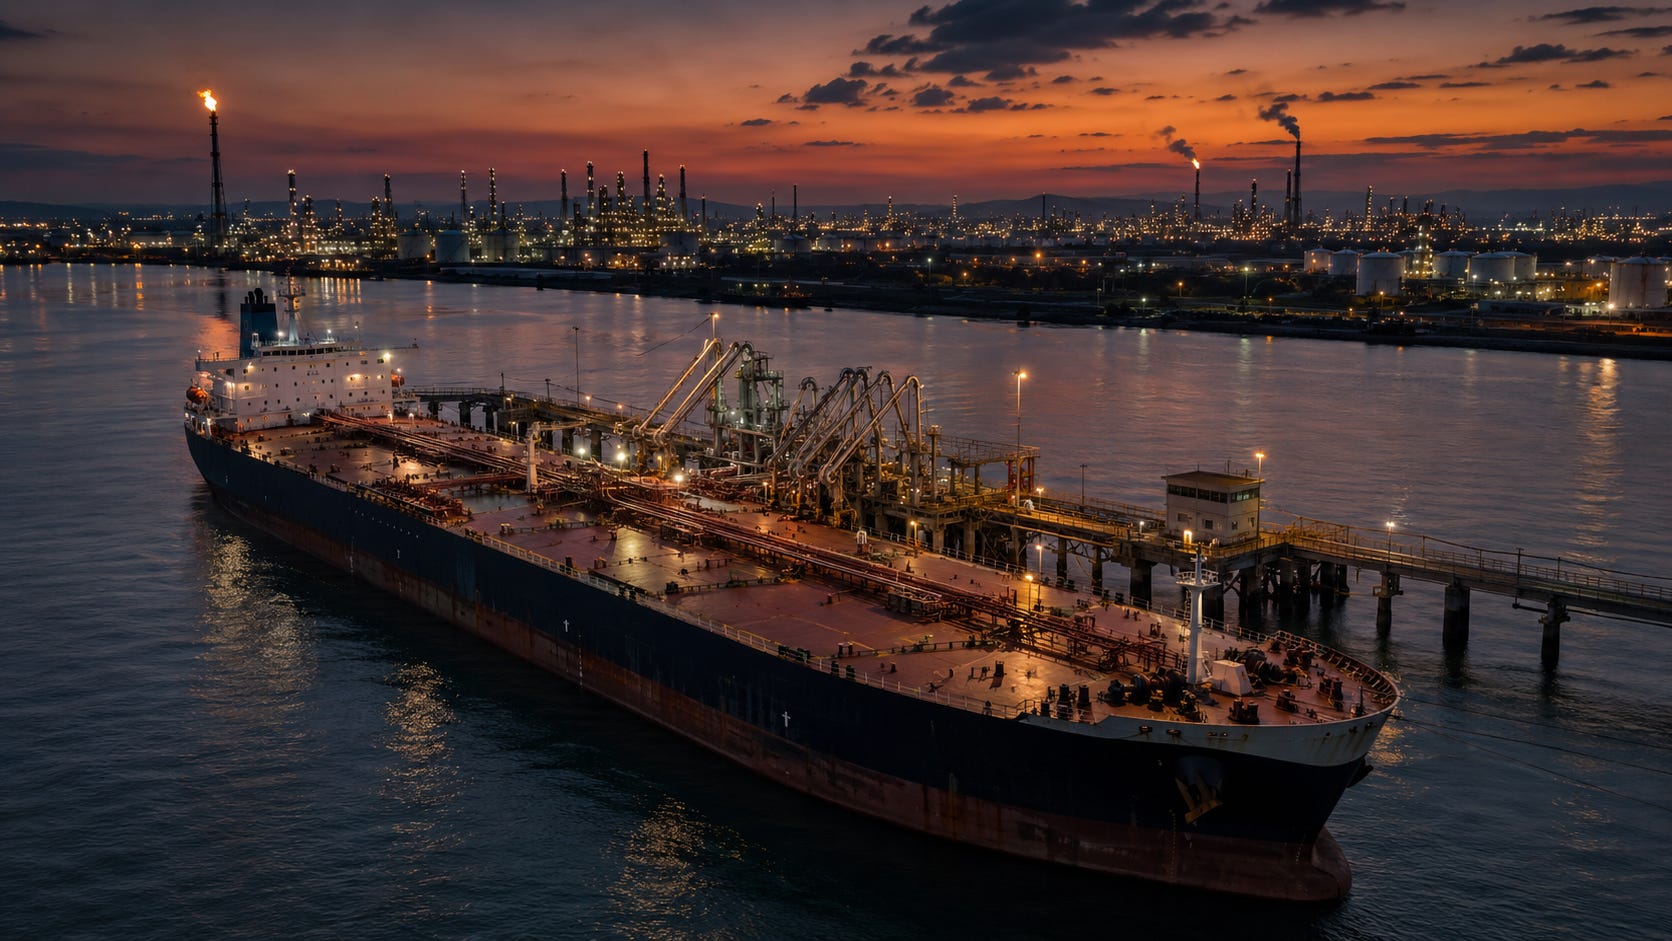
Start with Saudi Aramco, because Aramco’s story is the most strategically surprising. The company that owns the largest share of Gulf crude production is also, among Gulf producers, the one best positioned to sell Gulf crude without passing through the Strait of Hormuz, holding the region's largest-capacity overland bypass. Saudi Arabia built the East-West Pipeline, known as the Petroline, specifically for scenarios like this one: a 1,200-kilometer overland route that moves crude from the Eastern Province fields across the Arabian Peninsula to the Red Sea port of Yanbu, entirely avoiding the strait. When Iran sealed Hormuz, Aramco activated that bypass at scale.
The financial result was decisive. Aramco posted net income of US$32.5 billion for the quarter ending March 31, 2026, according to Fortune and Supply Chain Digital. That figure represented a 25% increase against the same quarter in 2025. The mechanism was straightforward: while most other Gulf producers struggled to get barrels to market through a contested strait, Aramco's barrels moved overland and departed from Yanbu, keeping export volumes stable and capturing the elevated oil price that the Hormuz disruption itself created. The company that owns the infrastructure to bypass the crisis also owns the crude that gets more valuable every day the crisis continues. Aramco did not create the disruption. It was uniquely equipped to profit from it, and the Q1 2026 income figure confirms that it did.
The Banks That Traded the Chaos
The second category of winner is the one most removed from the physical world of crude oil and vessel hulls, and the one whose profits may be the most startling to readers who think of the Hormuz war as a shipping story. The six largest US investment banks, JPMorgan Chase, Bank of America, Citigroup, Morgan Stanley, Goldman Sachs, and Wells Fargo, earned nearly US$48 billion in combined profit in the first quarter of 2026, according to Al Jazeera’s analysis published June 26, 2026, under the headline “Who has profited most from the war on Iran?” The biggest gains, Al Jazeera reported, came from the trading desks specializing in fixed income, currencies and commodities, the FICC divisions that sit at the intersection of energy markets, geopolitical risk, and financial derivatives.
The connection to Hormuz is direct. When a chokepoint that carries 20% of global seaborne oil closes, it does not simply remove supply. It injects extreme uncertainty into every market that prices oil, every currency pegged to or correlated with energy revenues, every interest rate in economies that import energy, and every commodity whose transport or production cost is linked to fuel. That uncertainty is the raw material of trading-desk profit. A FICC desk that can take positions on the direction of crude, the spread between benchmarks, the trajectory of producer currencies, or the shape of energy-linked credit spreads earns more when the range of outcomes is wide. The Hormuz closure of 2026 produced one of the widest ranges of outcomes in modern energy markets. The banks that are best positioned to trade volatility rather than be consumed by it earned accordingly, and the Q1 2026 combined figure of nearly $48 billion is the documented result.
The Tanker Owners Who Named Their Price
The tanker market is where the physical disruption of Hormuz translates most directly into revenue, and the Q1 2026 earnings figures for publicly listed tanker owners tell that story with unusual clarity. The mechanism, cited by Kepler Cheuvreux and reported across multiple outlets, was that the closure removed an estimated 7% of the effective global tanker fleet from circulation. Ships that would have made short Gulf-to-Asia runs were instead forced onto long detours, some rounding the Cape of Good Hope. The ton-mile demand that a redirected cargo generates is far higher than a direct Hormuz transit, and the tankers that were still available to carry Gulf crude at all commanded whatever rate they could name.
Frontline, the Oslo-listed crude tanker owner with one of the largest VLCC and Suezmax fleets in the world, reported net profit of US$559.1 million in Q1 2026 on revenues of US$714.2 million, according to Frontline's own first-quarter results published May 22, 2026, its strongest quarter since the fourth quarter of 2004. That net profit included a US$210.9 million gain on the sale of eight older VLCCs into the elevated secondhand market; even excluding that one-time gain, Frontline's adjusted profit of US$344.9 million was its highest in more than two decades, and its VLCCs earned an average spot Time Charter Equivalent of US$103,500 per day in the quarter. DHT Holdings, another listed crude tanker operator, secured charter rates above US$100,000 per day for some of its vessels. International Seaways, one of the largest US-listed tanker owners, reported a record quarter of its own, with Q1 2026 spot earnings of US$86,700 per day on its VLCCs, US$68,000 per day on its Suezmaxes, and a blended crude Time Charter Equivalent of US$72,811 per day, according to its first-quarter results; by late April it had already fixed 45 percent of its second-quarter VLCC days at an average of US$102,500 per day. The pattern across the listed owners is the same. In a normal market, spot Time Charter Equivalents for crude tankers run in the range of $20,000 to $40,000 per day, and the wartime freight market of Q1 2026 ran at roughly two to five times that level, pushing the biggest modern crude carriers above $100,000 a day.
Product tankers, which carry refined petroleum products rather than crude, also captured the surge, though they lagged crude. Ardmore Shipping, which operates a fleet of medium-range product tankers, earned US$33,700 per day on the spot market in Q1 2026 and had booked US$52,100 per day for the second quarter to date, with 55 percent of days fixed, according to its first-quarter results. Product tanker rates had been softer than crude rates in the pre-crisis period, but the dislocation of refinery flows and the redirection of refined product supply chains created a secondary wave of demand for product tanker capacity, and the climb from US$33,700 to US$52,100 per day between the first and second quarters is the clearest published measure of that segment catching up.
The aggregate picture from the tanker sector is of an industry that, in a single quarter, captured the financial equivalent of years of normal earnings compressed into ninety days. The disruption that was catastrophic for every importing economy was, for the owners of the ships carrying the oil, a windfall without modern precedent.
The Insurers Who Repriced the Whole Risk
The fourth category of winner is the one most invisible to media coverage: the marine insurance market. When the Hormuz crisis began, the standard war-risk premium for a vessel transiting the Gulf ran between 0.15% and 0.25% of insured vessel value per voyage, according to Al Jazeera. For a vessel insured at US$100 million, that baseline translated to a premium of US$150,000 to US$250,000 for a single Gulf transit, an amount that owners could absorb into their operating costs without difficulty.
The crisis changed that arithmetic entirely. Leading war-risk underwriters, including Gard, Skuld, and NorthStandard, three of the most significant names in marine insurance, raised Gulf-transit war-risk premiums to as high as 1.5% of vessel value, according to Al Jazeera. For that same US$100 million tanker, a single Gulf voyage now costs around US$1.5 million to insure. That is a six to ten times increase on the pre-crisis baseline. For a vessel making multiple Gulf transits in a quarter, the cumulative insurance cost could exceed the vessel’s entire annual depreciation charge. The owners who could pass that cost on to charterers did. The charterers who could pass it on to refiners did. The refiners who could pass it on to consumers did. The insurers collected the premium at every step.
What makes the insurance story structurally important for Gosships readers is the permanence of the repricing signal. War-risk premiums can be adjusted quickly by underwriters, but they tend to stay elevated long after a specific trigger has passed, because the underlying political risk, in this case Iranian control of the strait, has been demonstrated and documented. Even a durable reopening of Hormuz is unlikely to return premiums to the 0.15% to 0.25% baseline in the near term. The market has been repriced for the zone, and the insurers who wrote that coverage at 1.5% are collecting a margin that, for as long as the elevated rate holds, represents a structural improvement in their underwriting economics.
The Traders: A Brief Note
The commodity trading houses, Vitol, Gunvor, and Trafigura among them, also produced exceptional earnings in Q1 2026. Vitol generated around US$2 billion in profit in Q1 alone, according to investinglive. Gunvor's Q1 gross profit exceeded its entire previous full-year gross profit, according to Global Trade Review. Trafigura's net profit of $4.1 billion in the six months to March 2026 surpassed its entire full-year 2025 result, according to its half-year results. The mechanism in each case was the same: extreme price volatility, dislocated physical markets, and the structural advantage that comes from owning physical crude, refined product storage, freight capacity, and price risk simultaneously. The traders did not merely profit from the disruption. In several cases they helped intermediate it, buying stranded cargoes at a discount and reselling them at a premium. A separate Gosships article examines the trading-house earnings in depth. This article notes the numbers and moves on, because the more important points for the tanker audience lie elsewhere.
The Oil Majors
BP, one of the most widely watched Western oil major benchmarks, more than doubled its first-quarter 2026 profit to approximately US$3.2 billion from US$1.4 billion a year earlier, beating analyst expectations, according to Al Jazeera. The company cited an "exceptional" contribution from its oil trading desk. The mechanism for BP and the other international oil companies was similar to Aramco’s in principle, if different in scale and geography: elevated crude prices, driven by the supply shock of a closed Hormuz, flowed directly to the revenues of any company selling crude in the international market. The difference for a producer like BP versus a tanker owner like Frontline is that the oil major earns on price; the tanker owner earns on the cost of moving the barrel. In a Hormuz closure, both go up simultaneously, which is why both reported exceptional quarters.
The Mechanism That Ties It Together
Each of the winners described above profited from a different facet of the same underlying disruption, but the mechanism that connects them all is the tanker market. The 7% reduction in effective global fleet circulation, documented by Kepler Cheuvreux, is the transmission mechanism by which a closed strait becomes a windfall for producers, a trading opportunity for banks, an earnings surge for shipowners, and a repricing event for insurers. Without the tanker market as the physical intermediary, none of the financial effects would have traveled as fast or hit as hard.
Here is how the sequence ran. Iran closed Hormuz. Gulf crude could no longer take its normal short route to Asian refineries. Tankers that would have made the Hormuz transit began rerouting around the Cape of Good Hope, adding weeks and thousands of miles to each voyage. That rerouting consumed ship-time that would otherwise have been available for additional loadings, shrinking effective fleet capacity by an estimated 7%, according to Kepler Cheuvreux. The resulting scarcity of available tankers drove freight rates to historic levels, which the Q1 earnings figures from Frontline, DHT, International Seaways, and Ardmore all confirm. The historic freight rates created extreme volatility in energy commodity prices and derivative markets, which is what the bank FICC desks traded into $48 billion in combined profit. The elevated cargo values and geopolitical risk assessment drove the marine insurers to reprice Gulf-transit war-risk coverage from 0.25% to 1.5% of vessel value. And the crude price spike that the whole sequence produced drove Aramco’s quarterly income up 25% to US$32.5 billion.
The beneficiaries did not coordinate. They did not need to. The disruption created the conditions, and the market allocated the gains according to who was positioned to capture each facet. The answer, as the figures above show, was: the producer with the overland bypass, the banks with the trading infrastructure, the tanker owners with available tonnage, and the insurers with the capital to write the risk at the new price.
Who Pays
No accounting of who got rich off the Hormuz war is complete without naming who is on the other side of the ledger. The winners described above earned their gains because someone else paid them. The “who pays” question has a layered answer.
At the first layer, the importers paid. Every economy that buys seaborne crude without a domestic alternative, the major Asian economies, the European importers, the developing-world refiners that run on Gulf crude, absorbed the freight-cost increase, the insurance cost increase, and the commodity price increase simultaneously. The redistribution from energy-importing economies to energy-exporting economies and their logistics intermediaries is one of the oldest patterns in geopolitics, and the 2026 Hormuz crisis produced a particularly sharp version of it.
At the second layer, the consumer paid. Elevated crude prices and elevated freight costs move into refined product prices with a lag, and refined product prices move into fuel costs, heating costs, and transportation costs for ordinary consumers in every importing country. The gap between a tanker owner billing US$100,000 per day and a consumer paying more at the pump is not wide. It is the same market, measured at different points in the supply chain.
At the third layer, the cargo that never arrived paid. Refineries that ran short of crude because tanker availability had collapsed or insurance costs had made a voyage uneconomic did not simply absorb a cost. They curtailed production. Every barrel not refined is a barrel not sold, and the downstream effects, fuel shortages, industrial slowdowns, import allocation decisions by governments, are the final and least visible cost of the crisis.
The tanker market is where oil moves. When the strait closed, the market that moves oil became the market that determined who won and who lost from the closure. The numbers reported here are the documented result of that determination.
Related Coverage
Oil Just Crashed Below $75, on Track for Its Worst Week in Months as Hormuz Reopens. Is the Record Tanker Boom Already Unwinding?
A Greek-Owned Supertanker Just Banked $468,900 in a Day on a Gulf Rate One Analyst Calls Imaginary. Can It Possibly Hold?
The UAE Just Ended 59 Years in OPEC and Took Much of the World’s Spare Oil Capacity With It. Who Cushions the Next Shock?
📊 By The Numbers
