
Container Lines Still Refuse to Sail the Red Sea. Oil Tankers Just Surged Back Through Suez, Up 28% Year on Year. Why Are They Sailing Into the Danger Everyone Else Fled?
The Hormuz closure rerouted Gulf energy west. War-risk premiums fell. Now oil tankers are flooding back through Suez while container ships run Africa.

⚓ The Gosships Team
Gosships Intelligence Is Published At Gosships.com
For Sponsorship And Partnership Inquiries Contact intelligence@gosships.com
|⚓ About Us | 🛢️ Exclusive Report | 📋 SwiftAction Training |
🏅Black Gold Membership (*53 Slots Left)
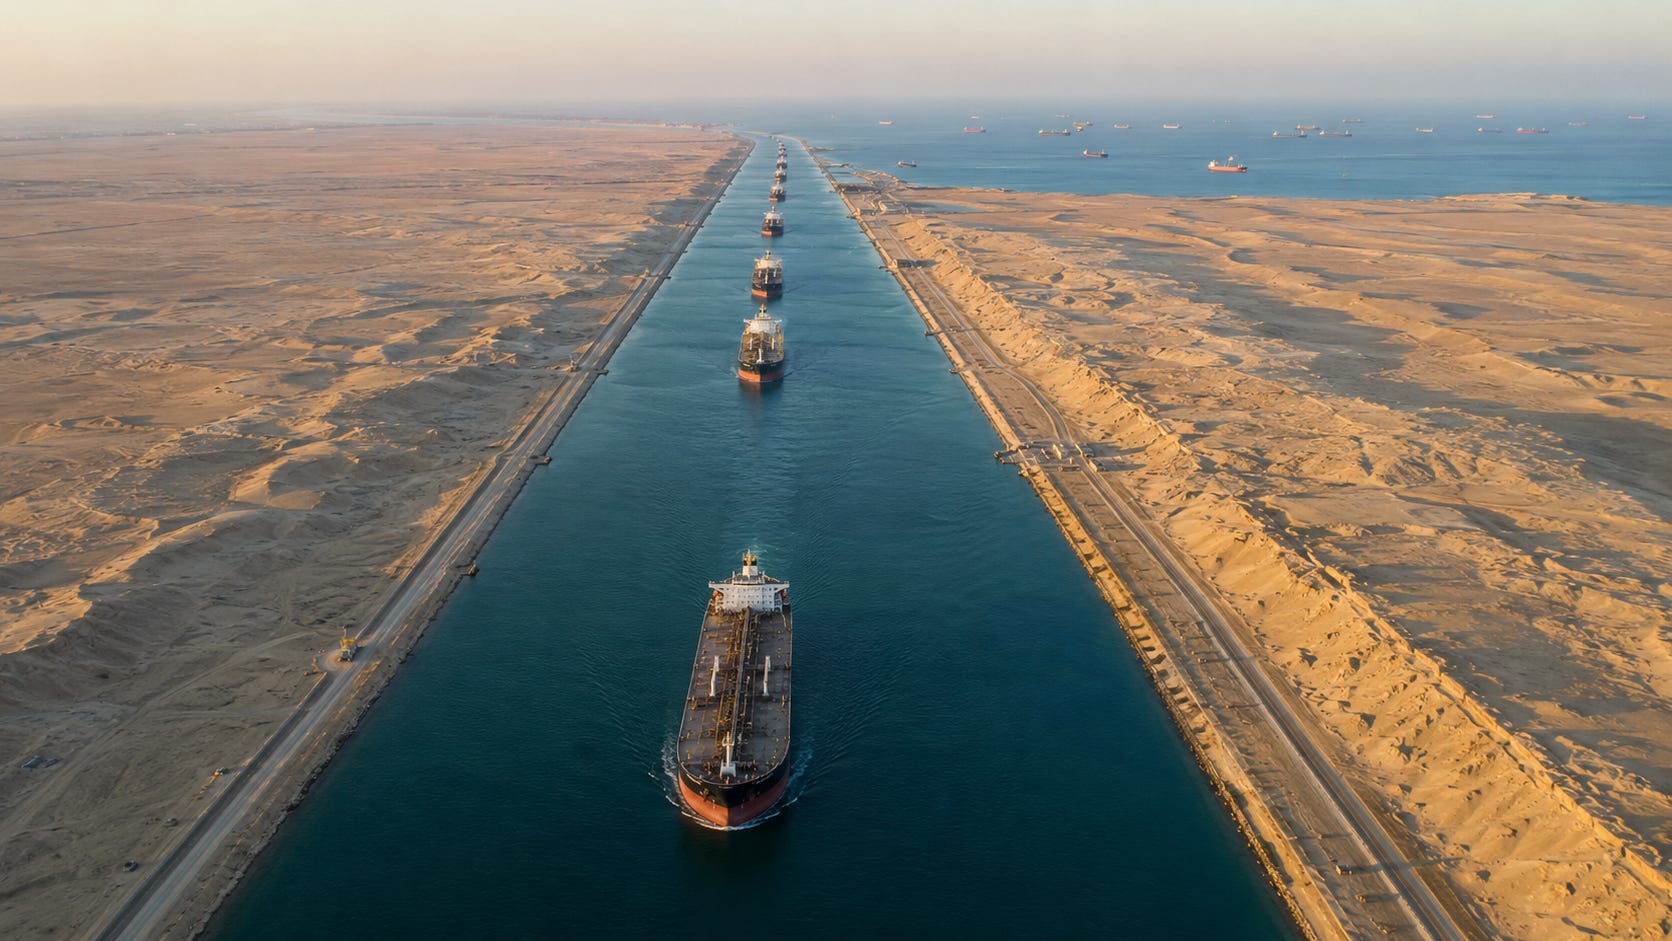
The same waterway. Two completely different fleets. Container lines have not gone back. Oil tankers just flooded in. The Suez Canal recorded 529 tanker transits in April 2026, a 28% jump year-on-year, according to Egypt’s state statistics agency CAPMAS as reported by Bloomberg and Rigzone on June 10, 2026. Total traffic across all vessel types reached 1,182 ships that month, up 14% from April 2025, with revenue climbing to $419 million, its highest monthly reading since early 2024. Meanwhile, container ship transits through the canal remain roughly 60% below pre-attack levels even 100 days after the last Houthi strike on a commercial vessel, according to BIMCO data published by Splash247 and gCaptain. Maersk has already rerouted select services back around the Cape of Good Hope after a brief tentative return to Suez. The Red Sea is the same body of water it was six months ago. But one fleet is coming back through it and another is not, and the reason tells you everything about how routing economics, tonne-mile math, and the war-risk insurance market create two completely different freight realities even inside a single geopolitical crisis.
📋 In This Issue:
🛢️ The Story
📊 By The Numbers
🔍 Why It Matters
👀 What To Watch
🚨 Gosships Signal
🔔 Not Yet Subscribed? Gosships Intelligence Delivers Oil Shipping Intelligence. Subscribe Here!
📊 Order Our Exclusive Report
→ Global Tanker Market Outlook Q3 2026 Edition
📋 Competency-Based Maritime Training
→ SwiftAction
📌 Gosships Data Card
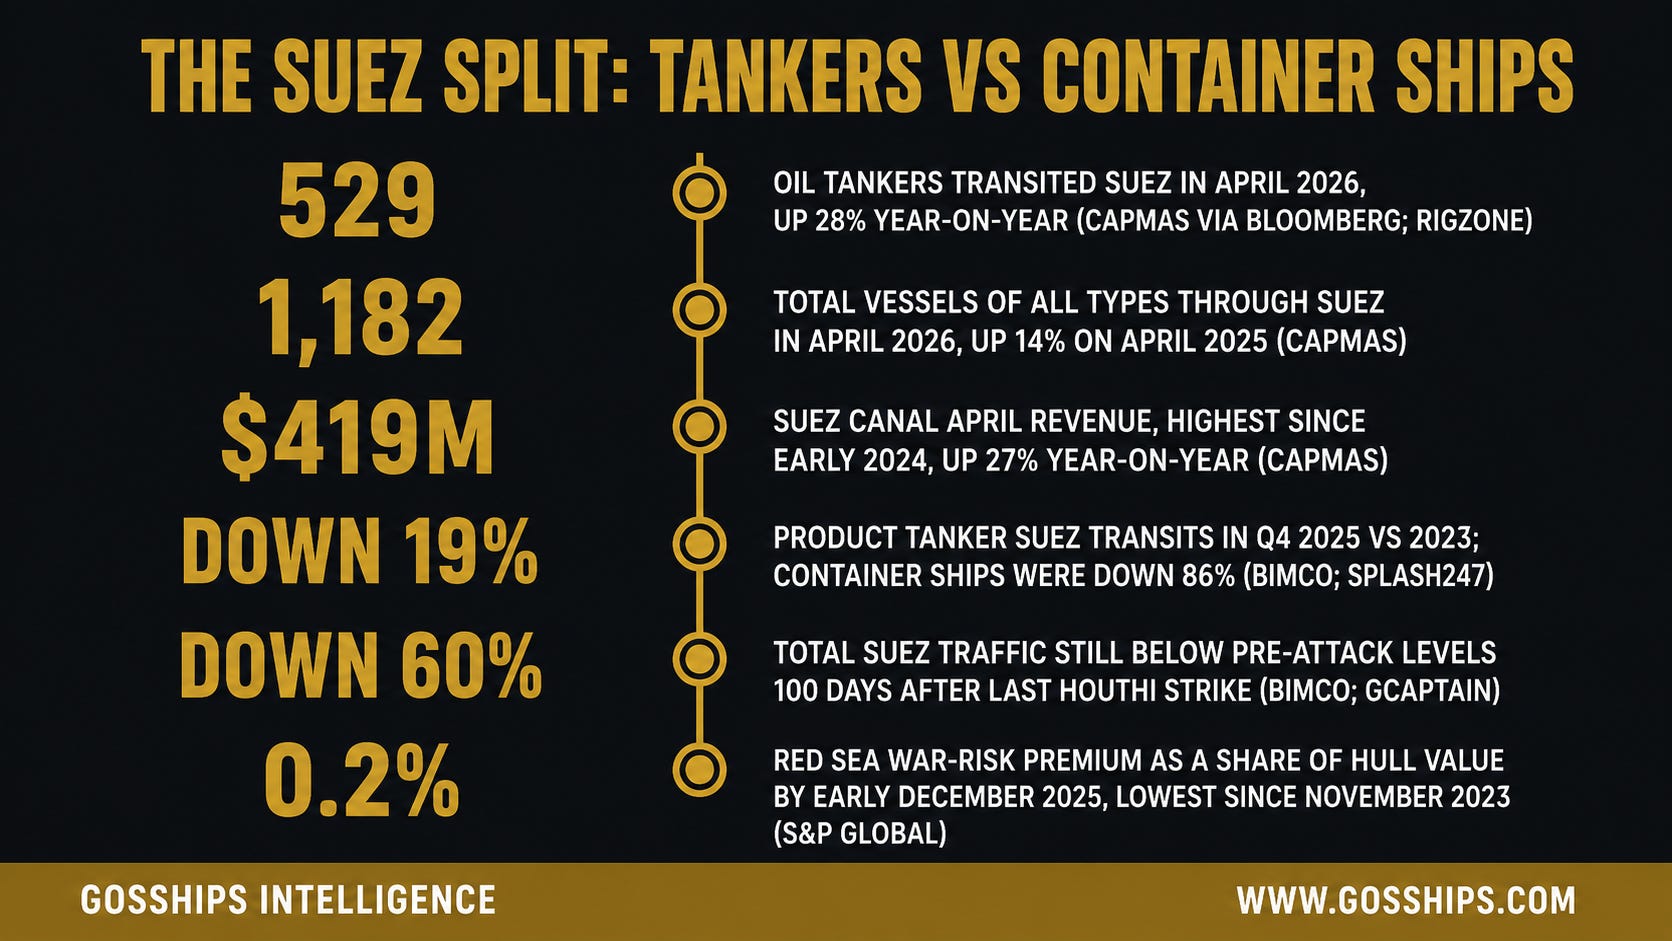
→ 529 - Oil tankers transited Suez in April 2026, up 28% year-on-year (CAPMAS via Bloomberg; Rigzone, June 10, 2026)
→ 1,182 - Total vessels of all types through Suez in April 2026, up 14% on April 2025 (CAPMAS)
→ $419M - Suez Canal April 2026 revenue, highest since early 2024, up 27% year-on-year (CAPMAS)
→ Down 19% - Product tanker Suez transits in Q4 2025 vs 2023; container ships were down 86% in the same period (BIMCO; Splash247)
→ Down 60% - Total Suez traffic still below pre-attack levels 100 days after the last Houthi strike on a commercial vessel (BIMCO; gCaptain)
→ 0.2% - Red Sea war-risk premium as a share of hull value by early December 2025, lowest since November 2023, down from roughly 0.5% before the ceasefire (S&P Global)
Sources: CAPMAS via Bloomberg; Rigzone; BIMCO via Splash247 and gCaptain; S&P Global.
🛢️ The Story
Start with the number that should not be possible given everything the Red Sea looked like twelve months ago: 529 oil tankers transited the Suez Canal in April 2026, a 28% increase year-on-year, according to data from Egypt’s state statistics agency CAPMAS, as reported by Bloomberg and Rigzone on June 10, 2026. Total Suez traffic across all vessel types reached 1,182 ships in April, up 14% from April 2025. Canal revenue hit $419 million for the month, the highest since early 2024, up 27% from the prior year, CAPMAS data show. This is a waterway that was described as all but closed to commercial shipping less than eighteen months ago. The Houthis were attacking. War-risk premiums had surged. Every major container line had already sprinted around the Cape of Good Hope and stayed there. And yet, in April 2026, oil tankers are coming back. Not all shipping, not even most shipping, but a very specific part of the fleet that found the math tilted back in its favor.
The contrast is precise and it is not subtle. While oil tanker transits surged 28% year-on-year in April, container ship transits through Suez remain approximately 60% below pre-attack levels even 100 days after the last Houthi attack on a commercial vessel, according to BIMCO data cited by Splash247 and gCaptain. In the fourth quarter of 2025, container ship transits through the canal were down 86% compared with 2023 levels, while product tanker transits were down just 19% in the same period, according to exclusive data published by Splash247. That gap, 86% versus 19%, is not a coincidence or a rounding error. It is the product of two different risk-versus-cost calculations, playing out in real time across two different segments of the global fleet in the same body of water.
To understand why the fleet split, you need to understand what drove oil tankers back and what kept container ships out. The first force is the Strait of Hormuz closure. The Hormuz strait, through which roughly a fifth of the world’s crude and liquefied natural gas once transited daily, has been effectively shut since shortly after the Iran conflict erupted on February 28, 2026, as Bloomberg and gCaptain reported. That closure forced Gulf energy producers to find alternative export routes almost immediately. Saudi Arabia activated a backup pipeline routing crude to the Red Sea port of Yanbu, as Bloomberg reported, from where it is loaded onto tankers and shipped overseas. The UAE pushed its own volumes through the Fujairah bypass pipeline, but Fujairah sits on the Gulf of Oman east of Hormuz, so that crude sails east to Asia and never approaches Suez. The Saudi shift was the one that fed the canal. With Saudi crude now loading at Yanbu on the Red Sea rather than transiting Hormuz, tankers servicing those cargoes had a simple geographic reality: to reach European and Mediterranean refineries, they were heading north through the Suez Canal or sailing an enormous additional arc around the southern tip of Africa, adding weeks to their voyage and burning thousands of additional tonnes of fuel per trip.
That voyage-distance arithmetic is central to why tankers came back when container ships did not. For a tanker carrying crude from Yanbu to Northwest Europe, the voyage north through Suez is many thousands of nautical miles shorter than the route around the Cape of Good Hope. That difference strips weeks of sailing off the round voyage, with bunker savings on a VLCC running to hundreds of thousands of dollars per round trip. For tankers whose freight market is priced in daily rate terms and whose economics are governed by tonne-miles, the delivered cost of taking the longer route is enormous and visible in the freight calculation almost immediately. The incentive to accept some additional war-risk premium in exchange for a far shorter, far cheaper voyage is direct and quantifiable.
The second force is the fall in war-risk insurance premiums for the Red Sea route. Additional war-risk premiums for tankers transiting the Red Sea fell to approximately 0.2% of hull value by early December 2025, the lowest level since November 2023 and down from roughly 0.5% before the ceasefire between Israel and Hamas, according to S&P Global’s reporting from December 2025. That decline in premium was driven by the pause in Houthi attacks on commercial shipping that followed the ceasefire in late 2025. For a product tanker with a hull value of around $40 million, the difference between a 0.5% and a 0.2% war-risk premium is approximately $120,000 per voyage, a figure that sits directly against the bunker and time-cost savings of taking the shorter Red Sea route. When the premium was high, the Red Sea math was still negative for many tankers even accounting for the shorter voyage. When the premium fell to 0.2%, the savings tilted positive for a much larger share of the tanker fleet, and those ships came back through Suez.
The third force is the nature of the Houthi targeting pattern itself. The Houthis expanded their attacks significantly after November 2023 and targeted a range of vessel types including oil and chemical tankers, bulk carriers, and container ships, as Human Rights Watch reporting and maritime security trackers from 2025 document. However, the pattern of attacks was not uniform across vessel types, and as the Houthis’ stated justifications evolved, container ships carrying goods to or from Israel-linked entities remained their most publicly stated priority. Oil tankers, particularly those not affiliated with Israeli-linked trade, did not carry the same symbolic target profile, even if they were not immune. Tanker owners and underwriters were able to price that distinction, however imprecisely, into their risk assessment. Container lines, whose vessels were the Houthis’ most-publicized targets and whose cargo manifests are far more traceable to specific commercial relationships, found no similar mitigation available. The risk calculus that says an oil tanker may face somewhat lower Houthi attention than a named container liner is crude and uncertain, but it is the kind of marginal distinction that, when combined with a large voyage-cost saving, tips a freight decision.
Product tankers in particular were the fastest segment to return. In the fourth quarter of 2025, product tanker Suez transits were down just 19% from 2023 levels, compared with a 45% decline across 2024, according to BIMCO and Splash247 data. This segment’s faster recovery reflects both the tonne-mile economics of its typical trade routes and the fact that product tanker war-risk premiums fell enough to make the Suez route commercially viable well before most other segments reached the same conclusion. By April 2026, with the Hormuz closure driving Saudi crude west through the Red Sea loading port of Yanbu, the tanker recovery accelerated further, lifting the year-on-year transit count to 529 vessels and boosting Suez Canal revenue to its highest in over two years.
Container lines present a completely different picture. Maersk, which made a tentative return to Suez in late 2025 when the Maersk Sebarok became the first Maersk vessel to transit the canal since early 2024, subsequently rerouted select services back around the Cape of Good Hope, as gCaptain reported, citing unforeseen constraints in the Red Sea region. That oscillation, a cautious return followed by a rapid retreat, captures precisely why container lines have not committed to the canal in the way tankers have. Container ships operate fixed-schedule liner services with published sailing dates and port-rotation commitments to thousands of shippers. A war-risk incident that delays a container ship by ten days, or forces it to divert mid-voyage, does not just cost the fuel and the premium. It cascades through the entire port rotation, misses connections, delays cargo delivery, triggers contract penalties, and damages the service reliability that liner customers pay for. For a tanker on a single-voyage charter, a delay is an additional cost. For a container line running a weekly liner service, the same delay can unwind weeks of scheduling and relationship commitments across dozens of ports.
The Cape of Good Hope routing that container lines chose after late 2023 also entrenched structural changes in how those services are configured. Adding seven to twelve days to Asia-Europe transit times required deploying additional vessels into each string to maintain weekly port calls. Those extra ships are now deployed, crewed, and contracted into the longer routes. Unwinding that deployment requires not just a decision to go back through Suez but the physical repositioning of vessels, the renegotiation of service schedules, and the coordination of port calls across multi-carrier alliances. Every week that container lines stay on the Cape route is another week of sunk repositioning cost that raises the threshold for returning. Industry analysts cited by Seatrade Maritime and Splash247 have suggested that meaningful container ship returns to Suez are not expected before late 2026 at the earliest, with some projections extending into 2027 given the persistent Houthi threat and the structural inertia of liner service design.
The tonne-mile dimension of this fleet split matters for the freight market beyond just the individual voyage economics. A product tanker running Yanbu to Northwest Europe via Suez is consuming roughly 15,000 fewer nautical miles per round trip than one running the same trade via the Cape of Good Hope. At scale, across hundreds of tanker voyages per month, that reduction in per-voyage distance effectively increases the available fleet capacity in the global tanker market. More ships completing more voyages in less time means more tonne-miles of capacity on offer, which is a softening force on freight rates. Container lines still running the Cape route are consuming more tonne-miles of capacity per voyage, which has supported container freight rates at elevated levels throughout 2025 and into 2026 because fewer voyages are completed in the same calendar period. The routing split thus produces opposing rate pressures across the two segments: the tanker market is gaining available capacity as ships return to shorter routes, while the container market retains the capacity-absorption effect of the longer diversion. Understanding that differential is at the core of reading where each market goes from here.
What the April 2026 data makes clear is that the fleet split is not narrowing fast. Total Suez traffic at 1,182 vessels is up 14% year-on-year, and the canal’s revenue recovery to $419 million is the strongest since early 2024, CAPMAS data show. But 1,182 vessels compares with roughly 2,300 ships per month before the Red Sea crisis, meaning overall Suez throughput is still running at barely half pre-crisis levels even with the tanker surge. The tanker recovery is real, it is significant, and it reflects genuine commercial and routing logic. But it is happening inside a canal that is still deeply depressed overall, carrying one segment that found the math worked and another that has not yet concluded the same. The routing choice that separates them, Suez versus Cape, is not arbitrary. It is the output of a freight calculation that every shipowner and charterer runs with every voyage fixture, and that calculation looks very different through the lens of a tanker owner than through the lens of a container line. That difference is the story of the Suez Canal in mid-2026.
For the energy trade, the split produces a concrete consequence that runs from the loading terminal to the refinery gate. Saudi crude flowing from Yanbu and product cargoes loading across Red Sea terminals are now reaching European and Mediterranean refineries via a faster, cheaper Suez passage than the Cape alternative, while Abu Dhabi crude exiting through Fujairah on the Gulf of Oman reaches Asian buyers without going near the canal at all. The delivered energy cost to the end refiner is lower as a result, with fewer days of transit time, lower bunker consumption per tonne delivered, and a marginally reduced freight component embedded in the CIF cargo price. That routing efficiency gain is not large enough to shift benchmark crude prices by itself, but it contributes to the broader supply picture: Gulf energy is reaching its destination markets on a tighter schedule than the Cape route would allow, which supports supply availability and moderates the freight premium that would otherwise compound the delivered cost of Gulf oil. The Cape-versus-Suez routing choice, in short, is not just a map question. It is a cost that flows through every barrel from the loading terminal to the refinery, and when that routing choice shifts for 529 tankers in a single month, the aggregate cost impact on delivered energy is real and measurable, even if it lands quietly.
